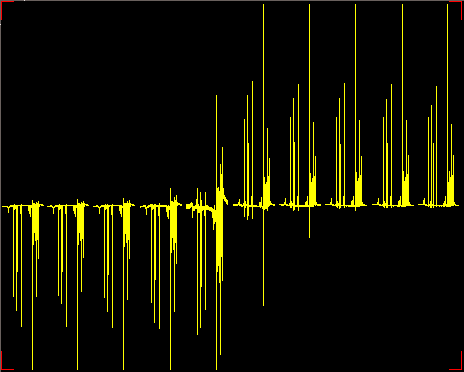
Hello, I wanted to ask this in a while. Finally a sample arrived that shows this behavior and I made a screenshot (below).
It's a 90 degree pulse calibration - using zero crossing near 360 degree pulse in standard one pulse FT experiment (arrayed pulse width at constant transmitter power).
Normally I expect a sine-wave-like picture as pulse width changes. Instead here there is a "binary" type of pattern - peak goes from all the way down then almost immediately all the way up. I've verified that there is no transmitter overflow - I've set receiver gain sufficiently low.
What's the physical explanation to this?