Hi,
I think this is probably a basic problem but I'm a bit inexperienced with NMR. I'm just trying to process an ethanol TOCSY spectrum from the biomolecular magnetic resonance data bank, but strange peaks are appearing at the very edge of the data.
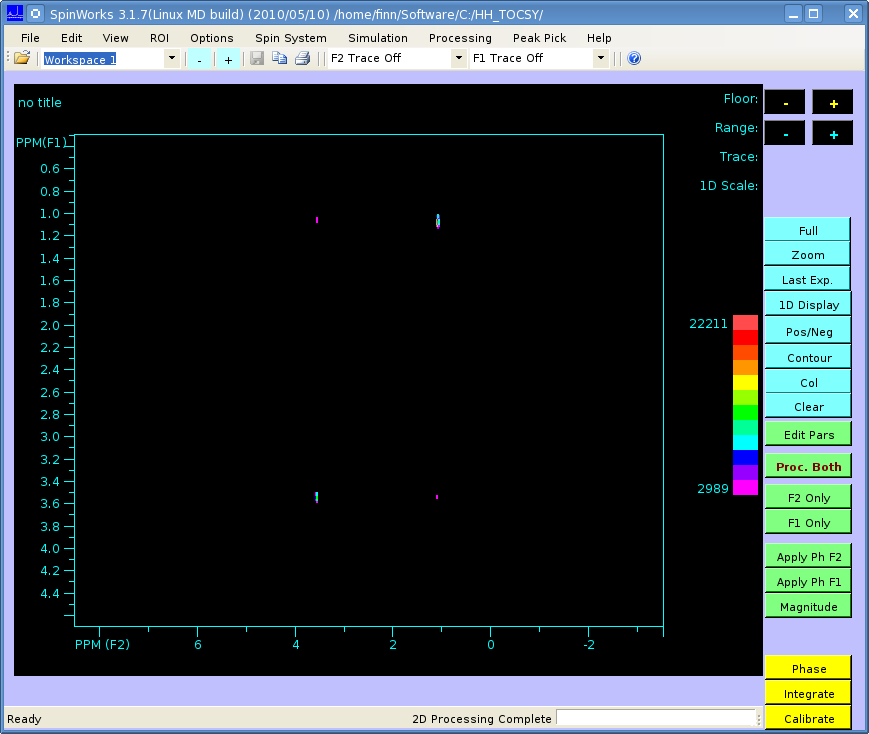
The spectrum should look like this (processed in SpinWorks):
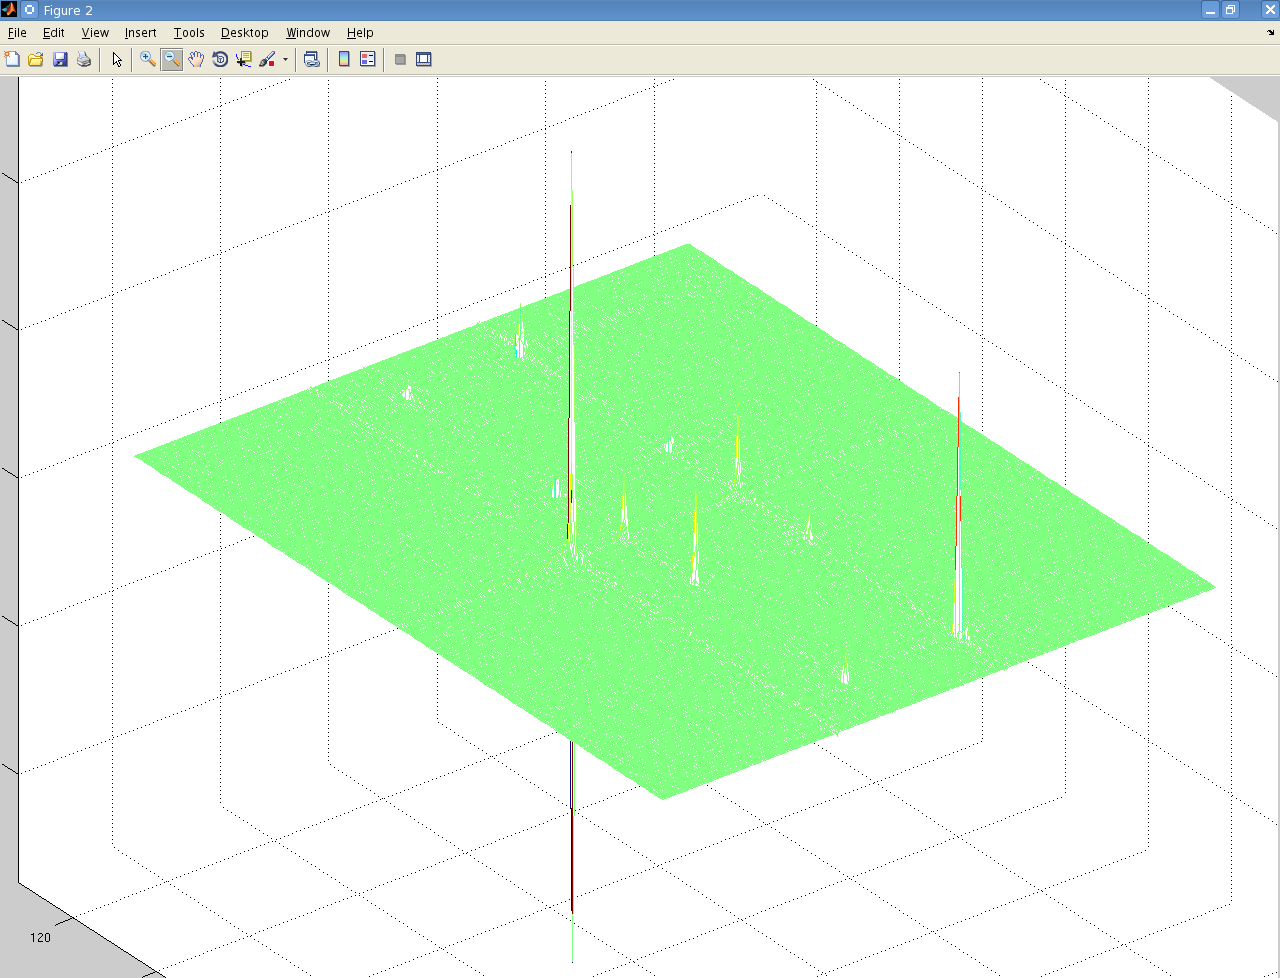
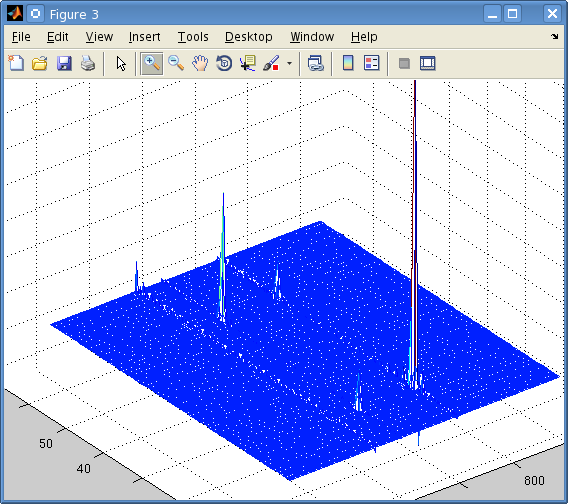
But when I perform a 2-dimensional Fourier transform using matNMR, or the fft Matlab functions I get the following:
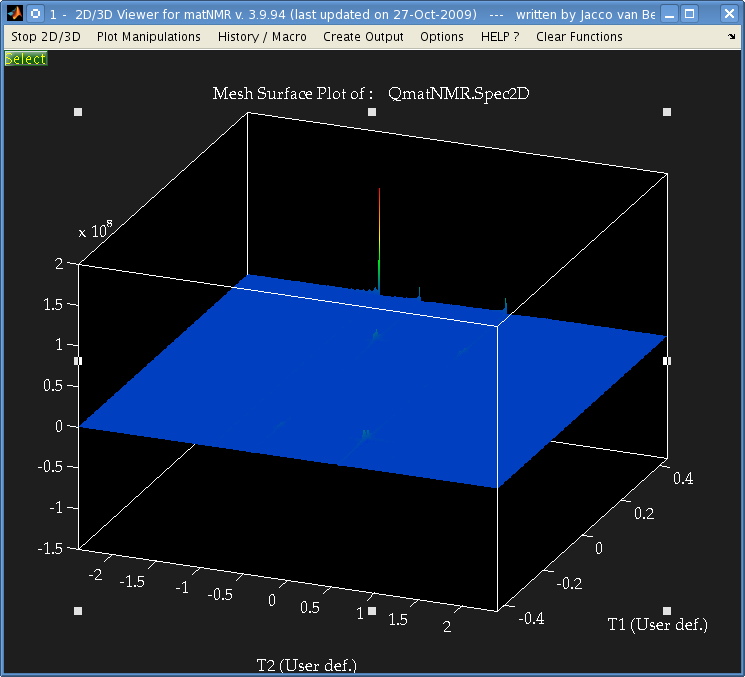
It's not easily visible but there are 4 small peaks in the body of the spectrum as well as the 3 large ones at the very edge.
The data is from a Bruker spectrometer recorded using TPPI. There were zeros at the start of the FID so I used the "remove Bruker digital filter" option before processing. I performed a Fourier Transform in the T2 direction, and then T1 direction and that is the result. I don't understand why there are peaks at the very far edge of the data, and performing an fftshift results in 3 peaks at zero frequency.
Is this a result of a problem with the phase, or possibly because of solvent peaks? I used the automatic phase adjustment but the peaks at the edge were still there.
Is there some mistake I'm making that causes those peaks to appear at the edge? I processed data from another brand of spectrometer which had used STATES and the spectrum was as expected without anything at the edges.
Also, when I process other Bruker TPPI spectra from the same data bank for adanine TOCSY and HSQC, and methanol I have the same problem.
Any ideas/sugestions would be much appreciated, Thanks